A KPI, which is short for “key performance indicator,” is a quantifiable and measurable metric used to track progress toward a specific goal. This article covers what is a key performance indicator and how it can help organizations identify both their strengths and weaknesses, make data-driven decisions and optimize their performance.
They provide teams with clear objectives to aim for, milestones to measure progress, and data to help guide decision making across the organization. By monitoring an indicator, organizations can identify areas of strength and weakness, make data-driven decisions and take action to optimize their performance.
1. Example of a KPI
In simple terms, key performance indicators are goals that you are working to achieve. To illustrate this simply, let’s imagine you have an apple stand and, to be profitable this month, you need to sell 1000 apples.
So, you set your KPI: sell 1,000 apples this month. Whether you sell 250 apples per week or manage to sell all 1000 in the first three days, your KPI is to hit that 1K mark. When the second week of September arrives and you’ve sold 550 apples, you can look at your KPI and know that you’re on track to meet your goal.
In business, KPIs can be high-level or drill down to a specific department or individual. High-level KPIs generally look at the performance of the entire business, such as reaching $1 million in annual recurring revenue this fiscal year. When you drill down into specific department, team or individual processes, those are low-level KPIs.
2. What are the benefits of KPIs?
The benefits of implementing KPIs are broad and well documented. They include improving employee engagement, aligning your team with your organization’s mission and fostering accountability.
In addition to tracking and controlling performance, metrics can provide your company with the following benefits:
- Improve employee engagement
- Connecting purpose and organizational culture
- Hold everyone accountable for performance
3. What makes a good KPI?
To generate valuable insights and support data-driven decision making, it is essential to identify and define the right indicators. So what makes a KPI effective? Here are some tips.
3.1. Aligned with the business
KPIs should be aligned with the overall business strategy and results. For example, let’s say your company aims to increase monthly recurring revenue (MRR) by 20% by the end of the fiscal year (a high-level KPI). If you are on the sales team, your KPI might be to increase inbound leads by 50% by the end of the third quarter (a low-level indicator). Your KPI contributes to the overall business goal, as more leads means more revenue potential.
3.2. Actionable
KPIs must be actionable. Once you have established your KPI, it should describe the steps you will follow to achieve it and the metrics you will measure in the process. What good is a KPI if you don’t have a plan to meet it? If your goal is to increase inbound leads, you must have a plan, such as converting more leads from the MQL stage to SQL. Actionable steps will set you up to successfully achieve your KPI. Also, KPIs should not generate additional questions, but inspire action.
3.3. Realistic
KPIs should be realistic. It is advisable to start gradually. Big and ambitious indicators, although they sound good in theory, are not beneficial if they are not realistic from the beginning, both for you and for your team.
3.4. Measurable
KPIs must be measurable. When setting KPIs, ask yourself: What are you trying to achieve? What is the desired end result? What is the time frame? Be sure to add: How will I measure my KPIs? Often, using an analytics or Business Intelligence tool is a great way to track progress against your KPIs. This way, you can create a metric, such as number of leads, and easily visualize your progress on a data dashboard (and share it with others in your team or organization! We love a data-driven team!).

4. How to define a KPI
It can be confusing to distinguish between KPIs and business metrics. KPIs should be related to a specific business outcome and measured as a performance measure.
Let’s look at an example of how to set a KPI. Let’s say your business goal is to increase monthly recurring revenue, so your team sets a sales growth KPI.
Here’s how you can define the KPI:

Read more about it at: The 20 most common KPIs
5. What is the difference between a key performance indicator and a metric?
Although the terms “KPI” and “business metric” are often used interchangeably, they are different concepts. A business metric is a quantifiable measure used to track and evaluate the status of a specific business process, such as website traffic.
On the other hand, an indicator is a way of measuring performance that helps to understand how an organization, department or individual is performing relative to strategic objectives.
In short, every KPI is a business metric, but not every business metric is a KPI.
The difference between a KPI and a metric is subtle. However, it is important to note that, despite their differences, one is often required to have the other. Below is a side-by-side comparison of a KPI and a metric:

6. What are KPI reports?
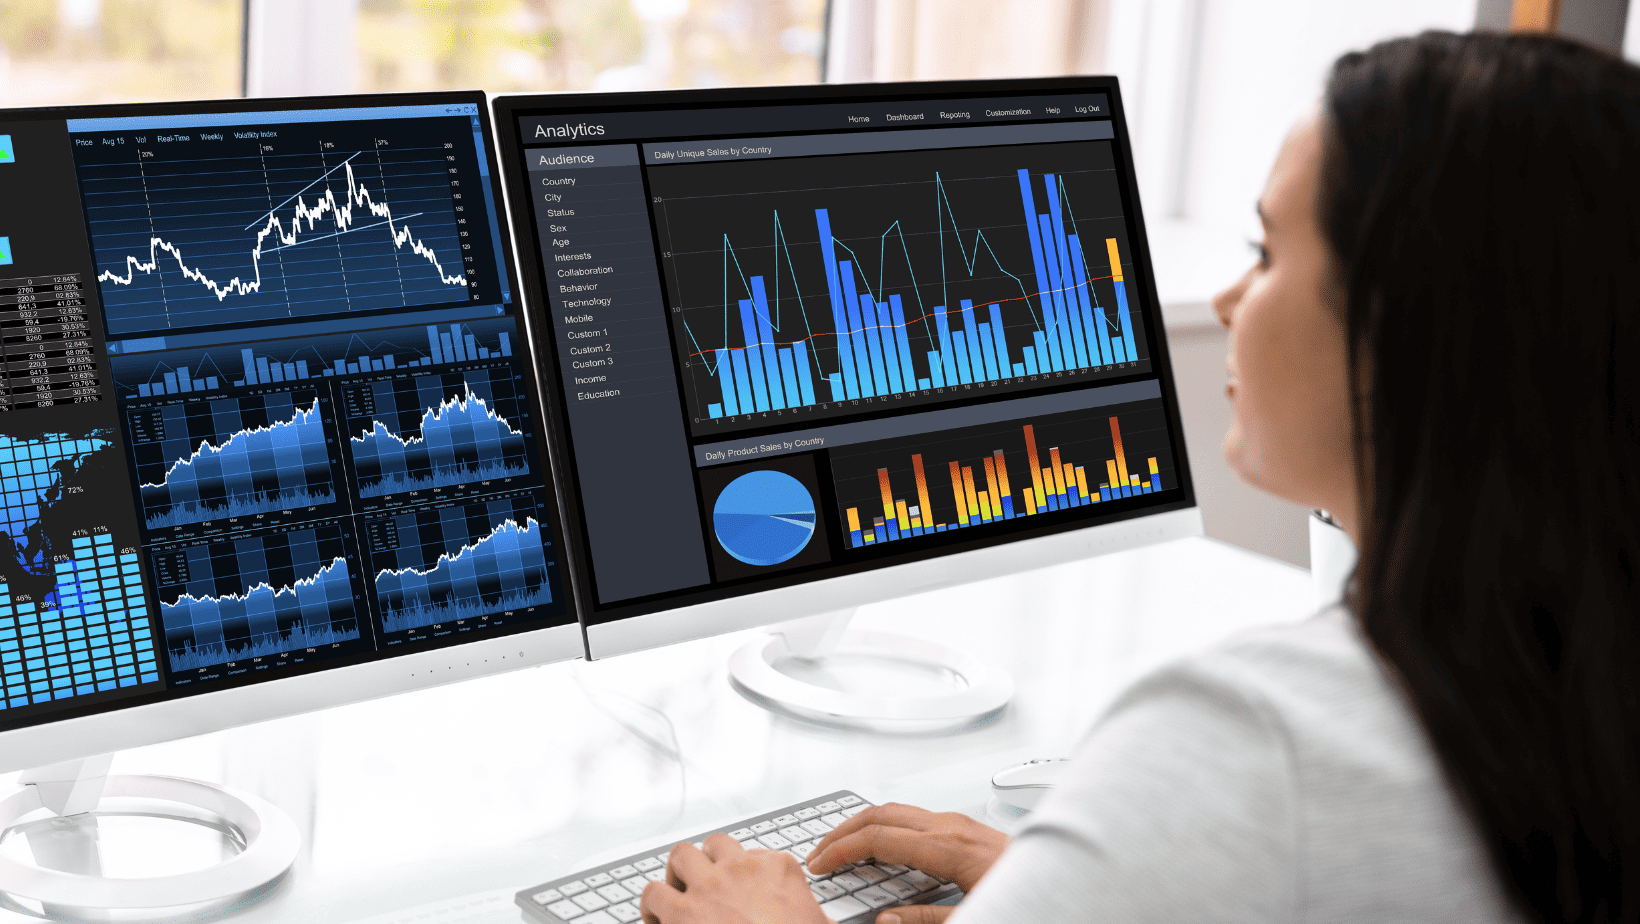
If you’ve learned what a key performance indicator is, you may have also encountered the term “KPI report”. KPI reports, also known as key performance indicator reports, are a summary of all the important indicators you have for a project, campaign or overall operations. They are usually created using interactive dashboards and/or reporting software that users can edit and share.
In summary, the reporting of these indicators serves as a strategic monitoring tool and provides a comprehensive view of core business activities and their performance in all aspects.
Read more about this topic at: KPI categories
7. How to create a KPI dashboard
Creating a KPI dashboard involves following a systematic approach to ensure its effectiveness in tracking and analyzing critical metrics.
Define the purpose of your dashboard: Is it to share information with people who have difficulty reading raw data, or to persuade management to take action? Clearly identifying the purpose of your panel helps determine which indicator to use, how to present them, and when to monitor, among other things.
Identify the panel’s audience: Is it the stakeholders? The marketing team? Knowing who exactly your panel is intended for helps determine which indicator to use, how to present them, when to monitor, and more.
Select the right KPIs: focus on a concise set of metrics that provide a clear and meaningful view of your organization’s progress. It is not necessary to include all available indicators to generate a complete report.
Choose the right visualizations: What kind of graphs, indicators and tables will effectively convey the information at a glance? Select the images that best suit the data you want to present in a clear and understandable way.
Design the layout: organize indicators logically, considering factors such as hierarchy, grouping and visual flow. Keep the design clean, orderly and easy to navigate so that users can quickly access the information they need.
Gather feedback: before sharing a KPI dashboard with the rest of the team, test it with a small group of users to evaluate usability and functionality. Make adjustments based on user feedback with the goal of improving the overall experience.
Remember that it is important to maintain and regularly update your KPI dashboard to ensure that monitoring is done in real time or near real time.

We hope this article has helped you clear up some doubts about what a KPI is and why you need to make them an essential part of your business.
8. Keep learning with these articles
Hopefully, by now you have a solid understanding of what a performance indicator is, you can continue reading more articles that will help your brand or business in our Blog.


